The prod-VM
How to access the prod-VM
The test/prod machines wont have a GUI. Because they will only be accessible via the dev-VM which means it is ssh only.
- Log on to
space-rshiny-dev - Open a terminal window
- From the command line
ssh space-rshiny-prodhas a key set up and will log you in directly (without asking for your password).
Although ssh-key authentication is in place from dev to prod and test, we recommend changing the passwords the first time you log on, using 'passwd' from the command line.
How to transfer apps from the dev-VM to the test-VM
Follow the same process as described in 503328396503328396, only anything rleated to 'test-VM' has to be replaced by 'prod-VM'.
Usage Statistics
Simple usage statistics
If you have admin rights (as defined in /usr/bin/shiny/application.yml in admin-groups:) go to the
In the example below user 'jack' is currently accessing the app '01_hello', and it has just started running (see Uptime).

More in-depth usage statistics on the prod-VM using Micrometer
Following https://www.shinyproxy.io/documentation/usage-statistics/. Starting from ShinyProxy 2.5.0 an extra plug-in was added that supports for Micrometer.io. Micrometer itself is a modular library that allows to support many popular monitoring system. Our focus is to export Prometheus Metrics.
ShinyProxy can keep track of the following actions:
- User Login
- User Logout (also by expiring session)
- Authentication failure
- Application start
- Application stop
- Duration of application startup
- Duration of application usage
- Application start failures
How to access the monitoring tools (using Prometheus and Grafana)
- Log onto the space-rshiny-dev VM desktop
- Open a terminal window
- Open a web browser
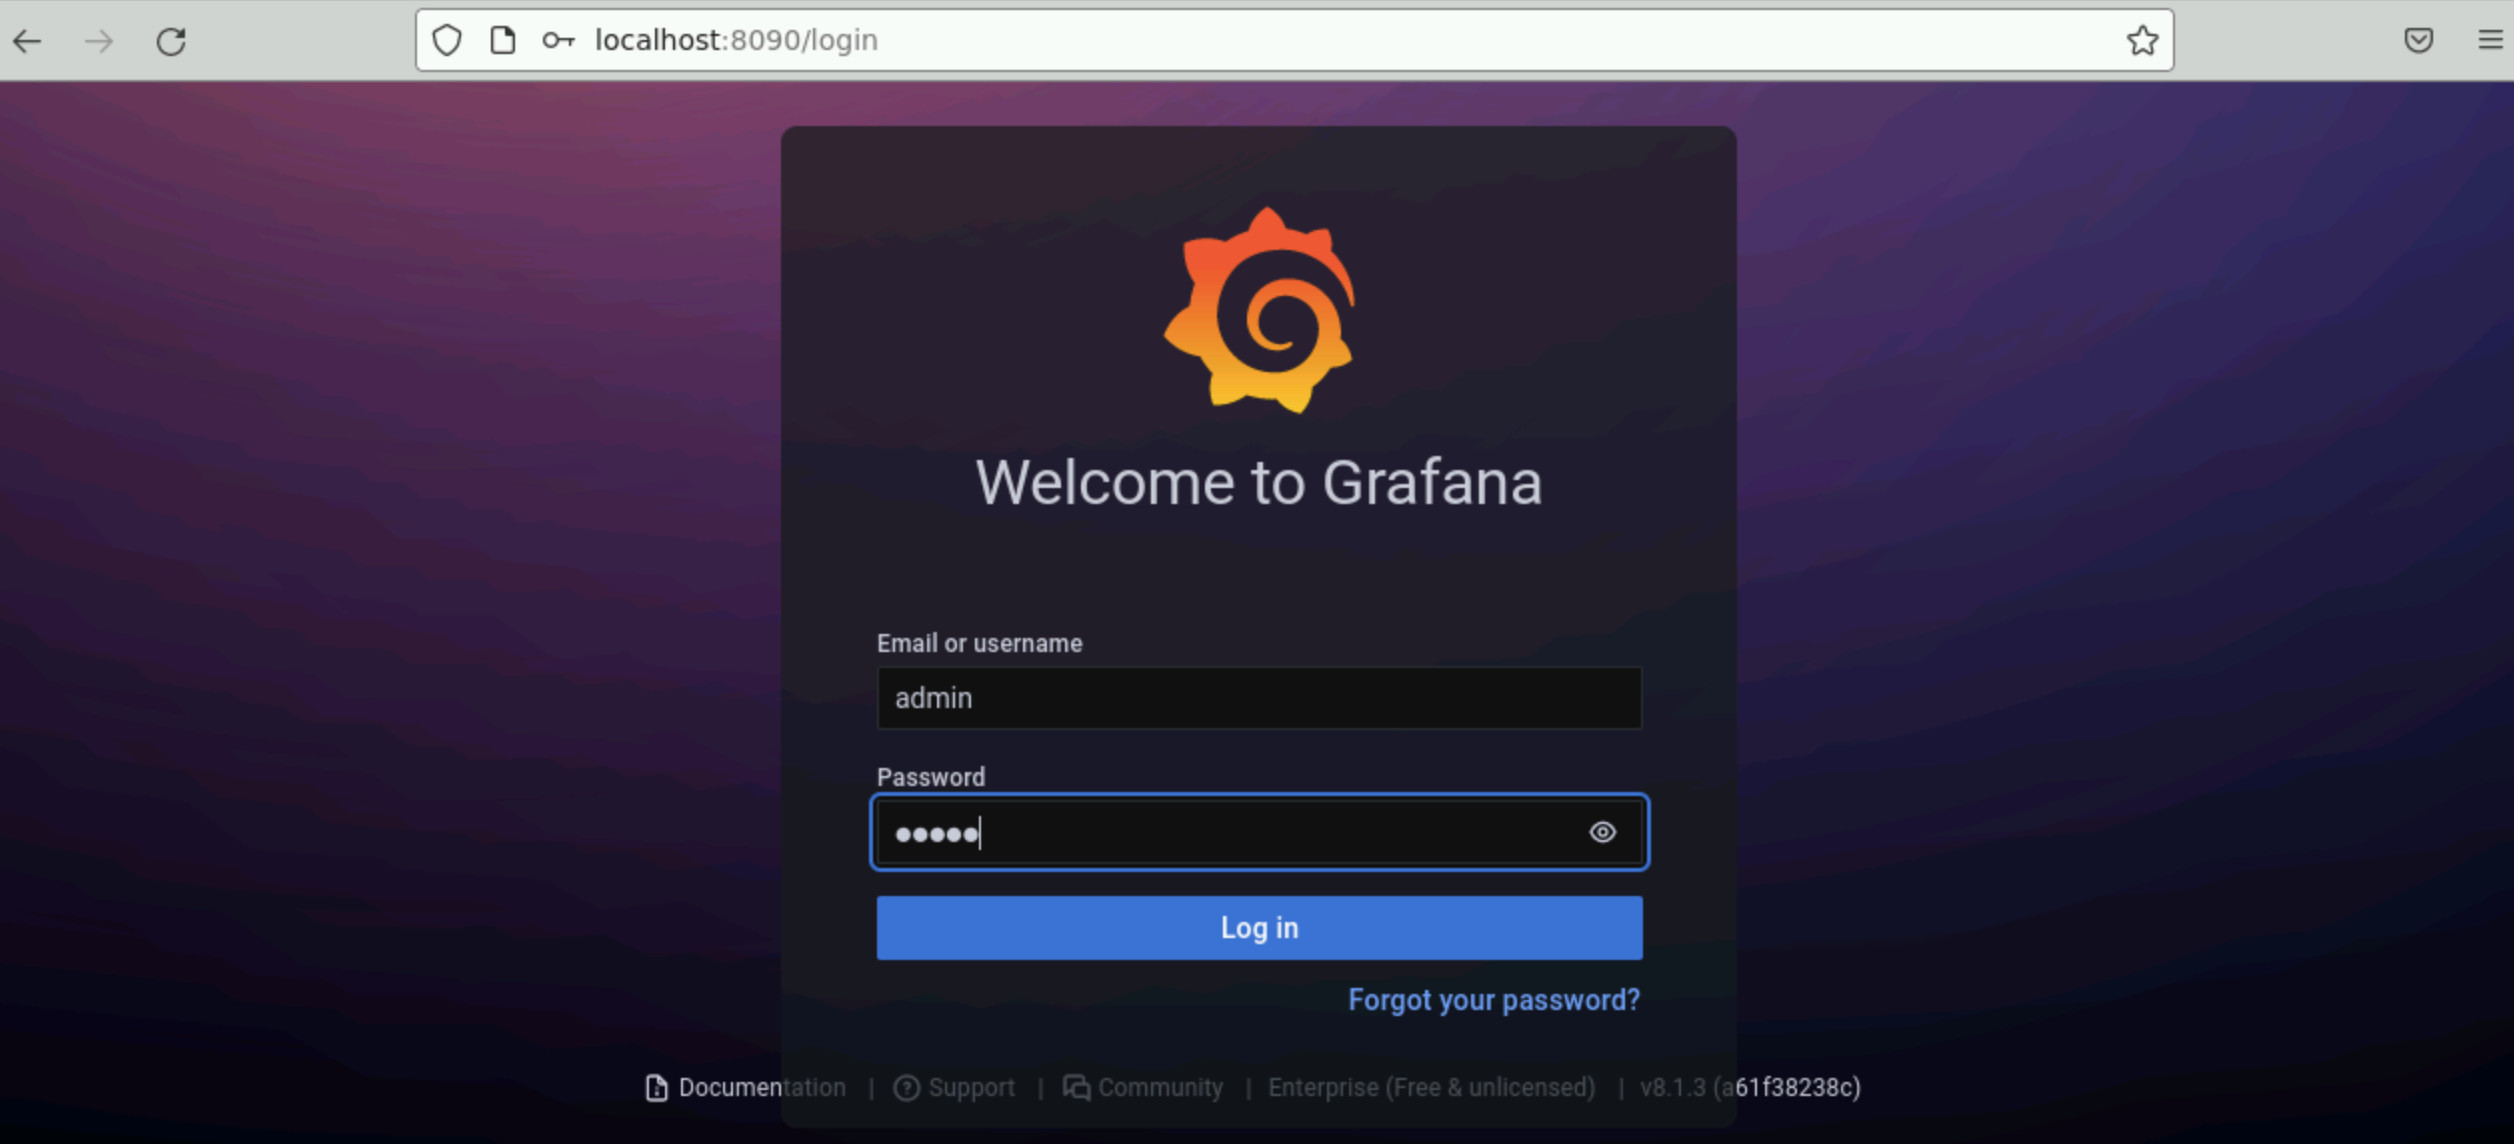
- In the terminal window type: 'ssh -L 8090:localhost:3000 space-rshiny-prod' // This logs you onto the prod-VM and port 3000 on the prod-VM can be displayed as port 8090 in the local browser on the dev-VM now
- In the web browser (your browser is on the dev-VM) enter as URL: 'http:localhost:8090'
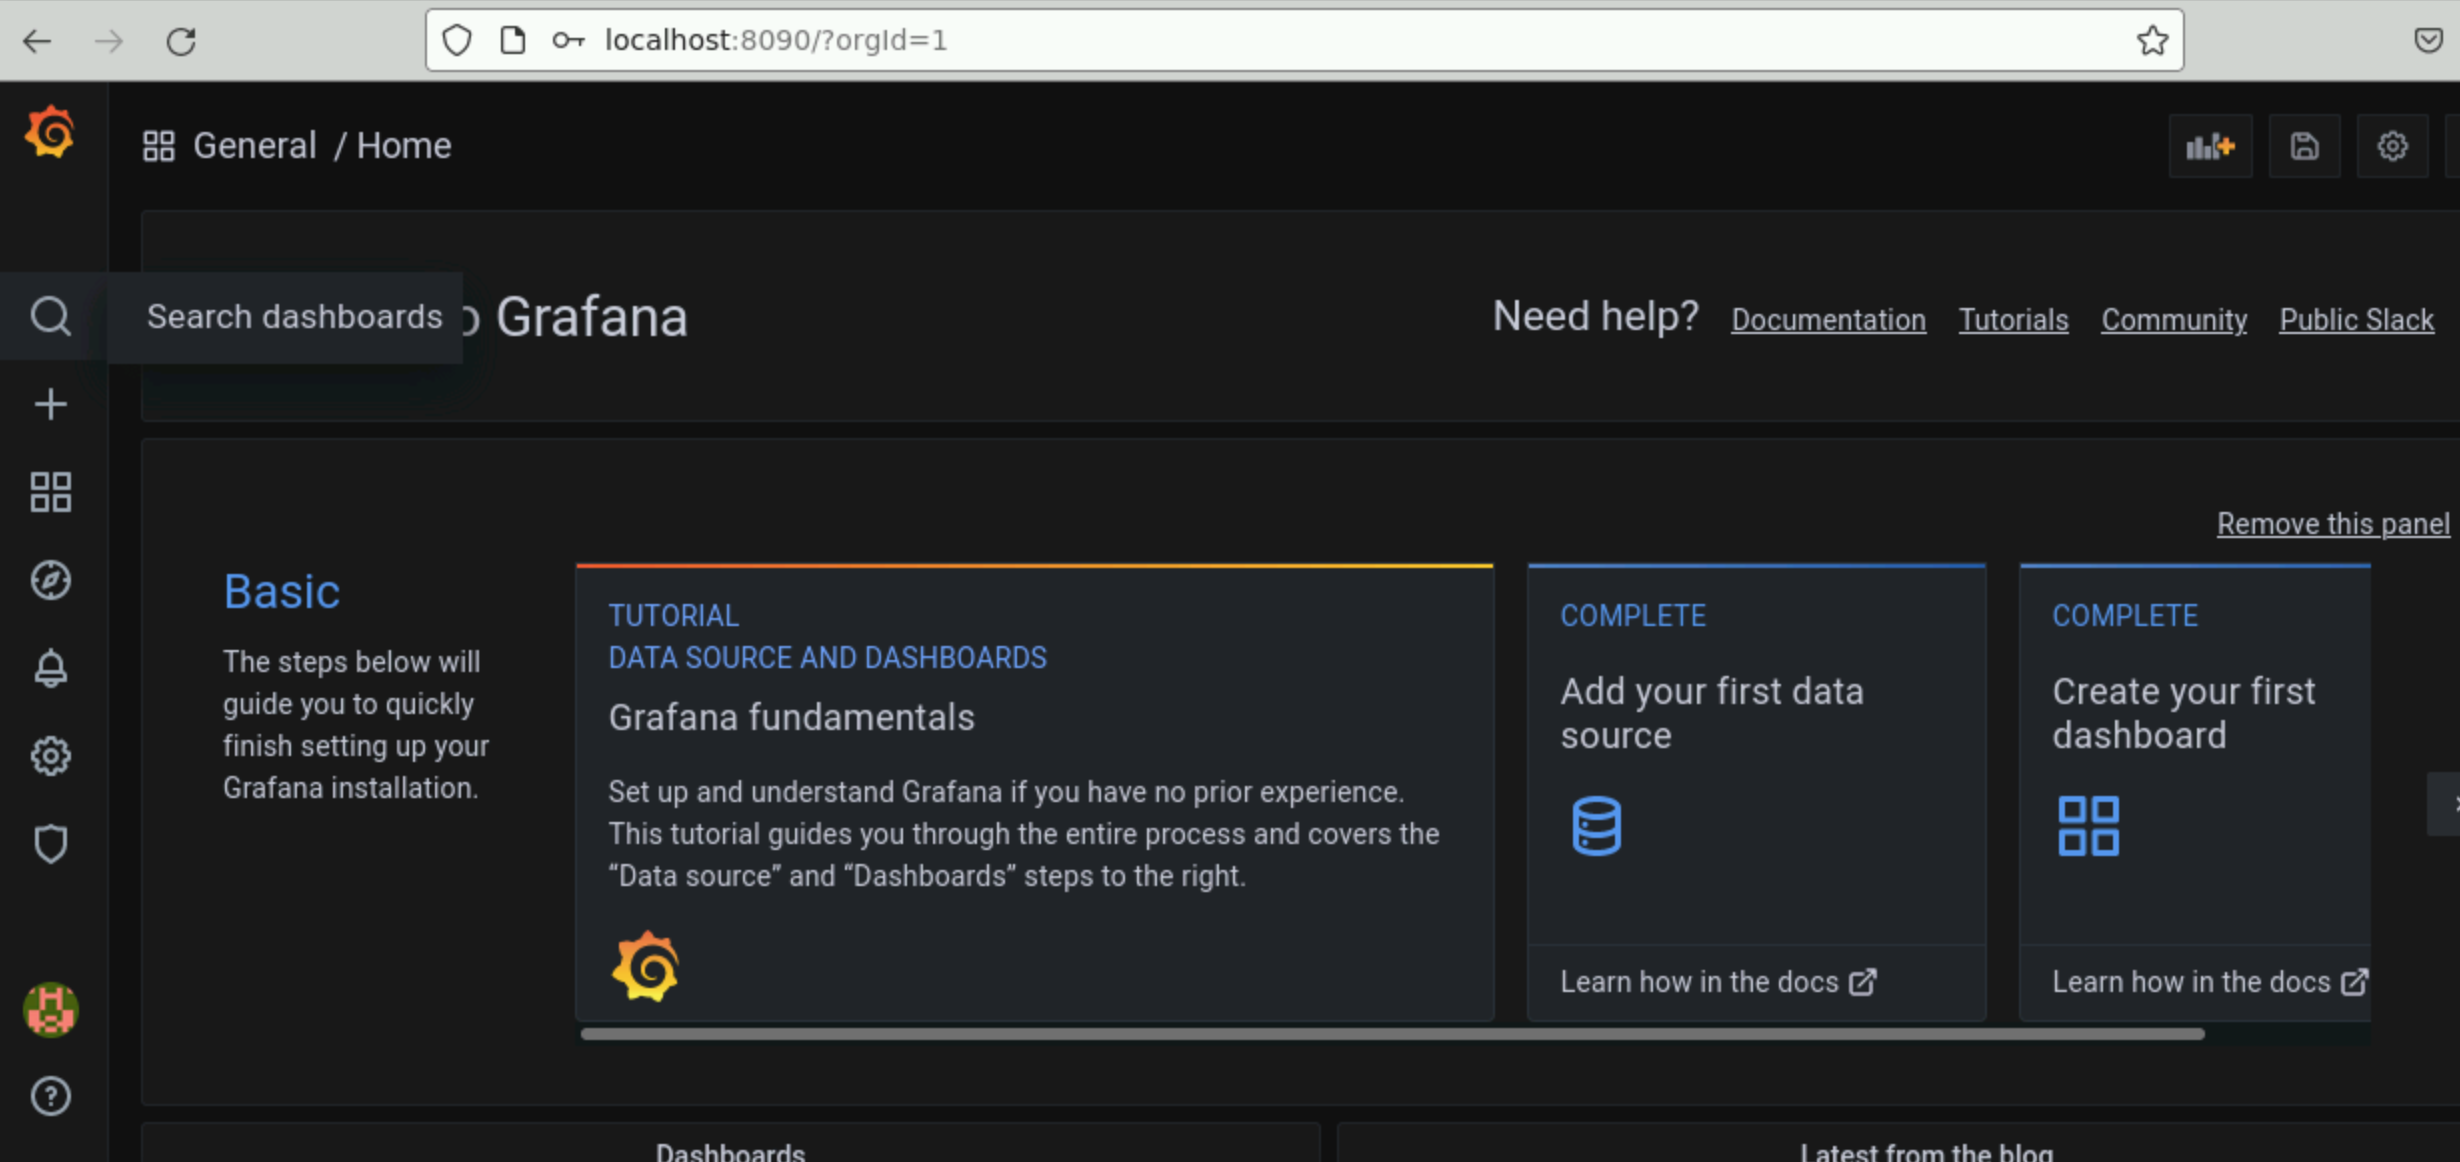
- This should bring you to the Grafana login page on the prod-VM. Ask SPACe helpdesk for an account

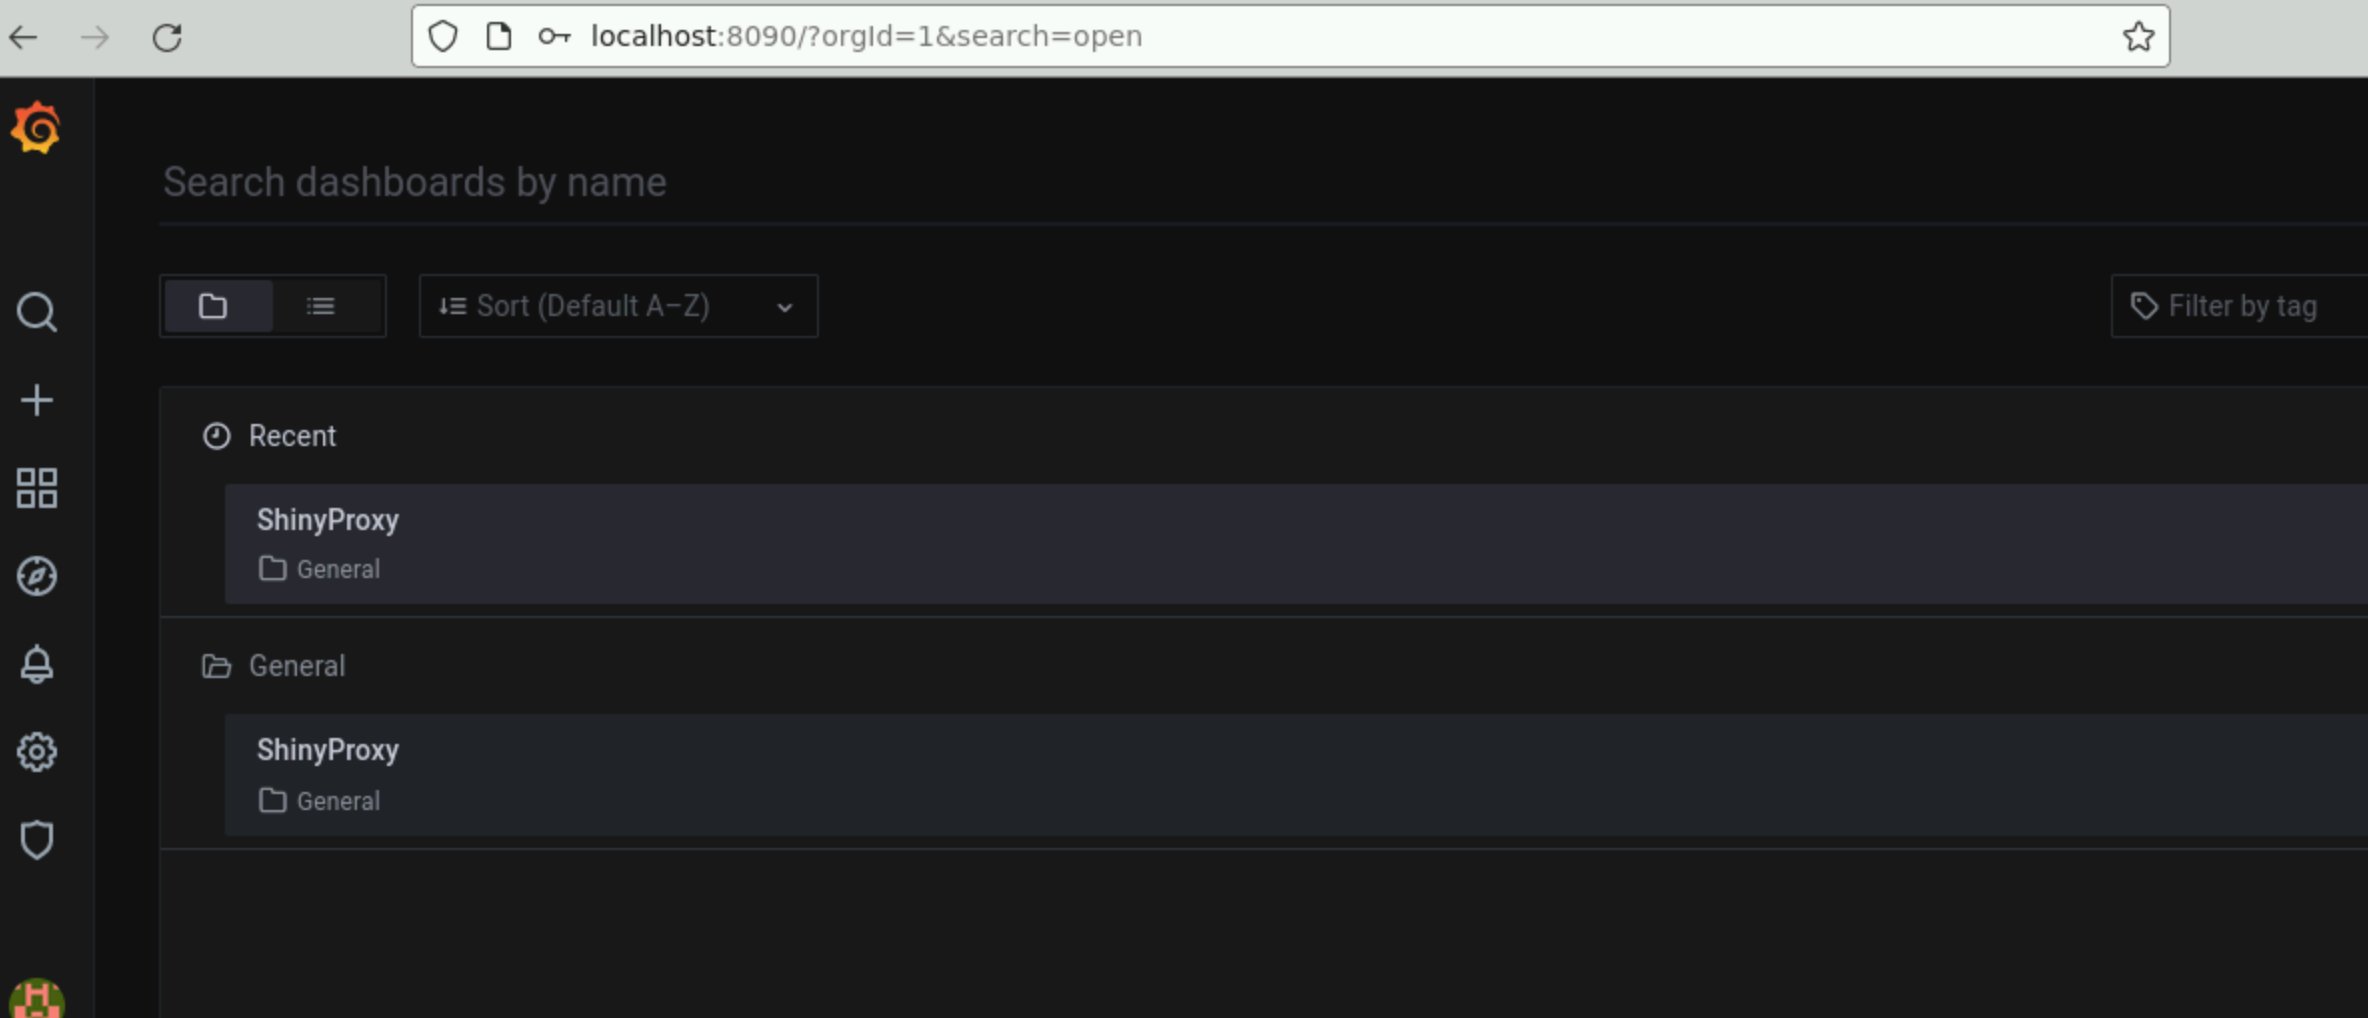
Choose 'Search dashboards' when hovering over the looking glass on the left hand side

Choose 'ShinyProxy' (the only dashboard available)

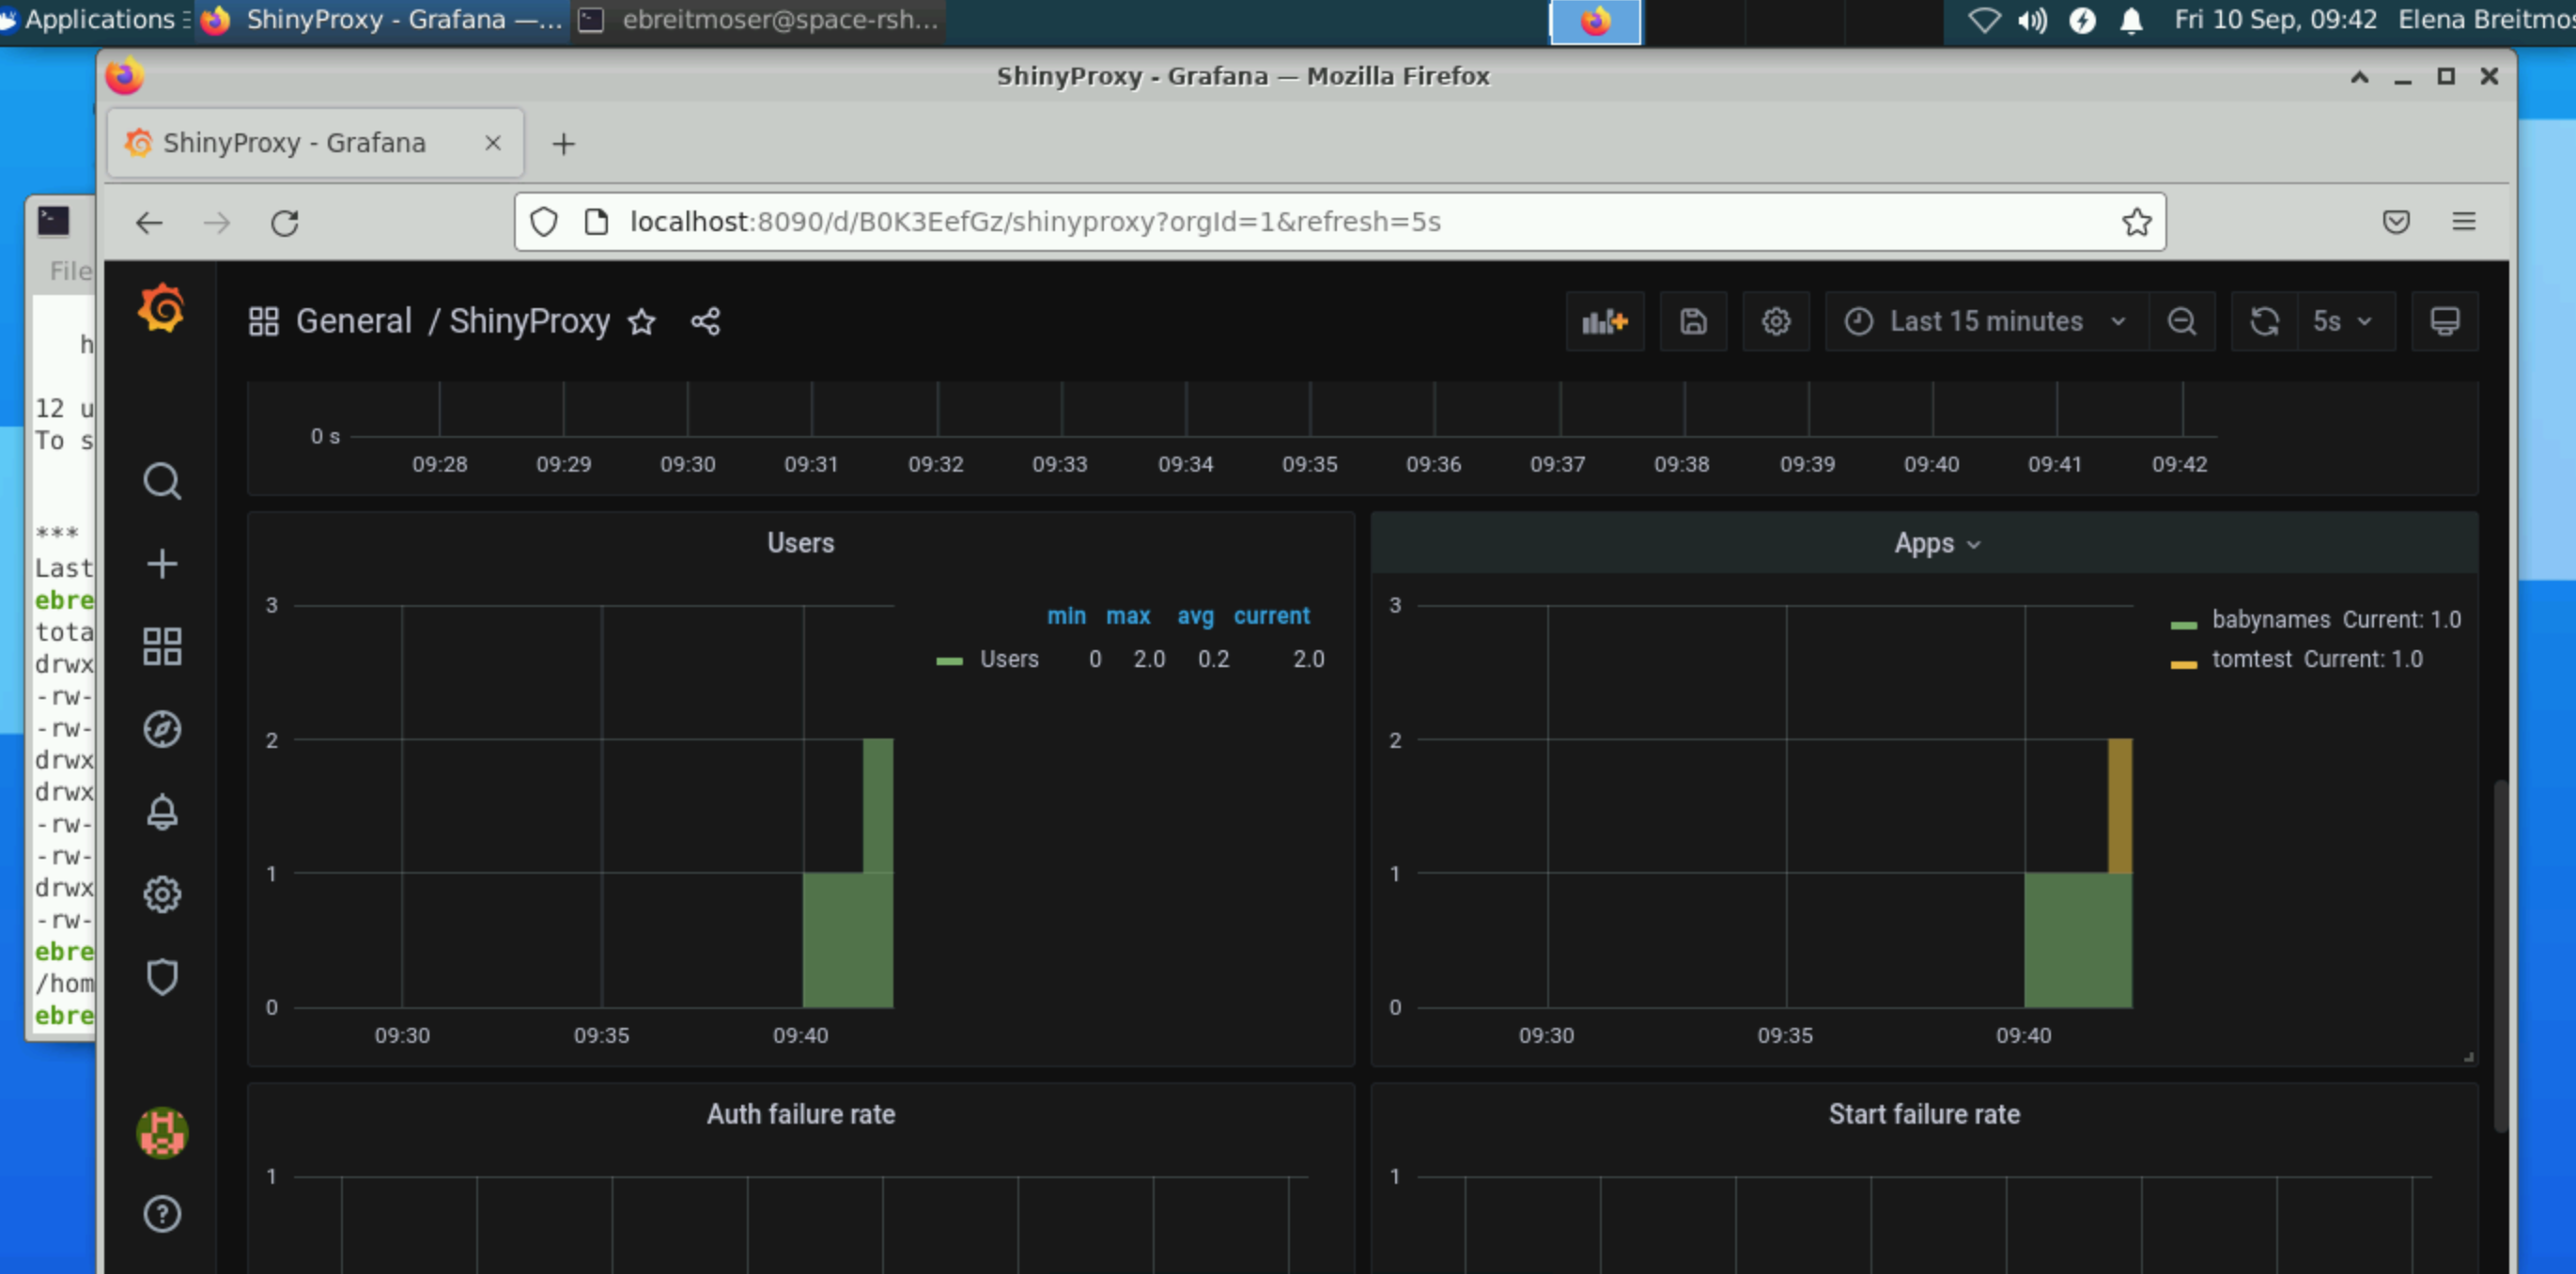
Now you should see the dashboard
